Example Gallery of some of the PRELIMINARY results
These are preliminary, all rights reserved T. N. Varga and the Dark Energy Survey.
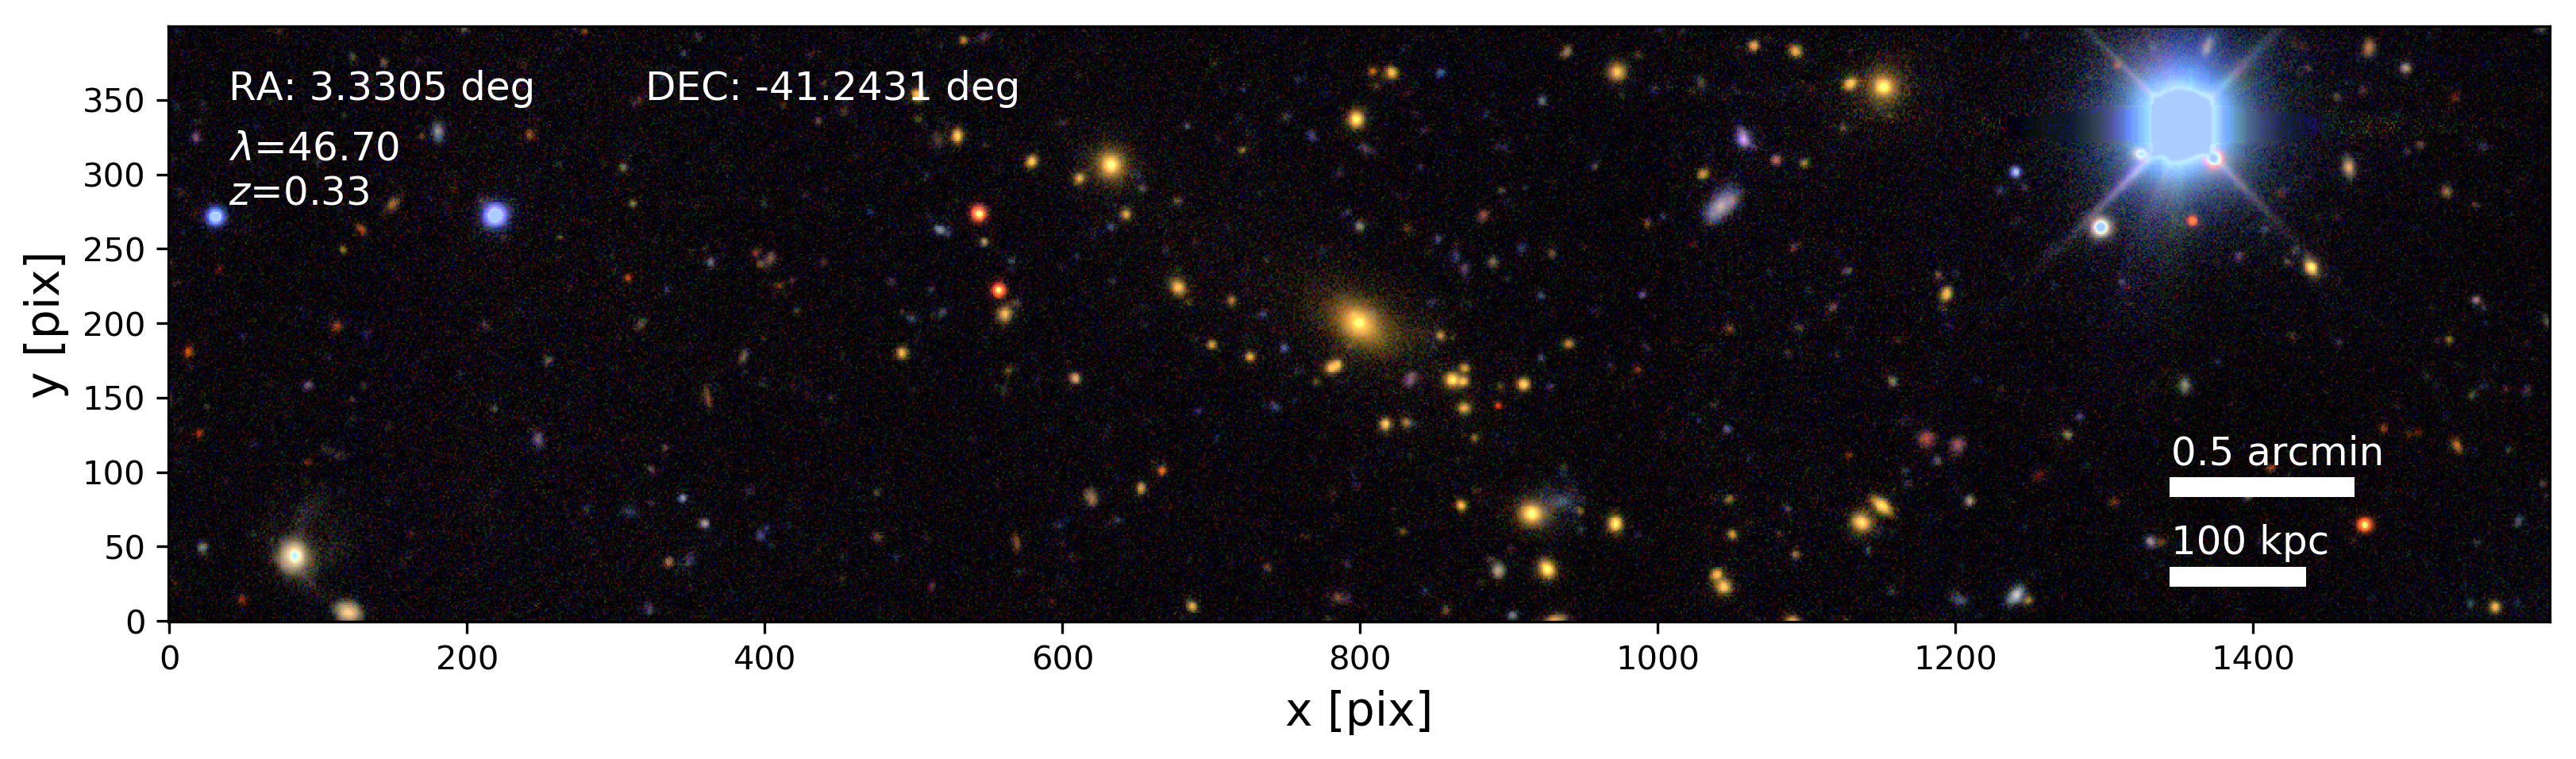
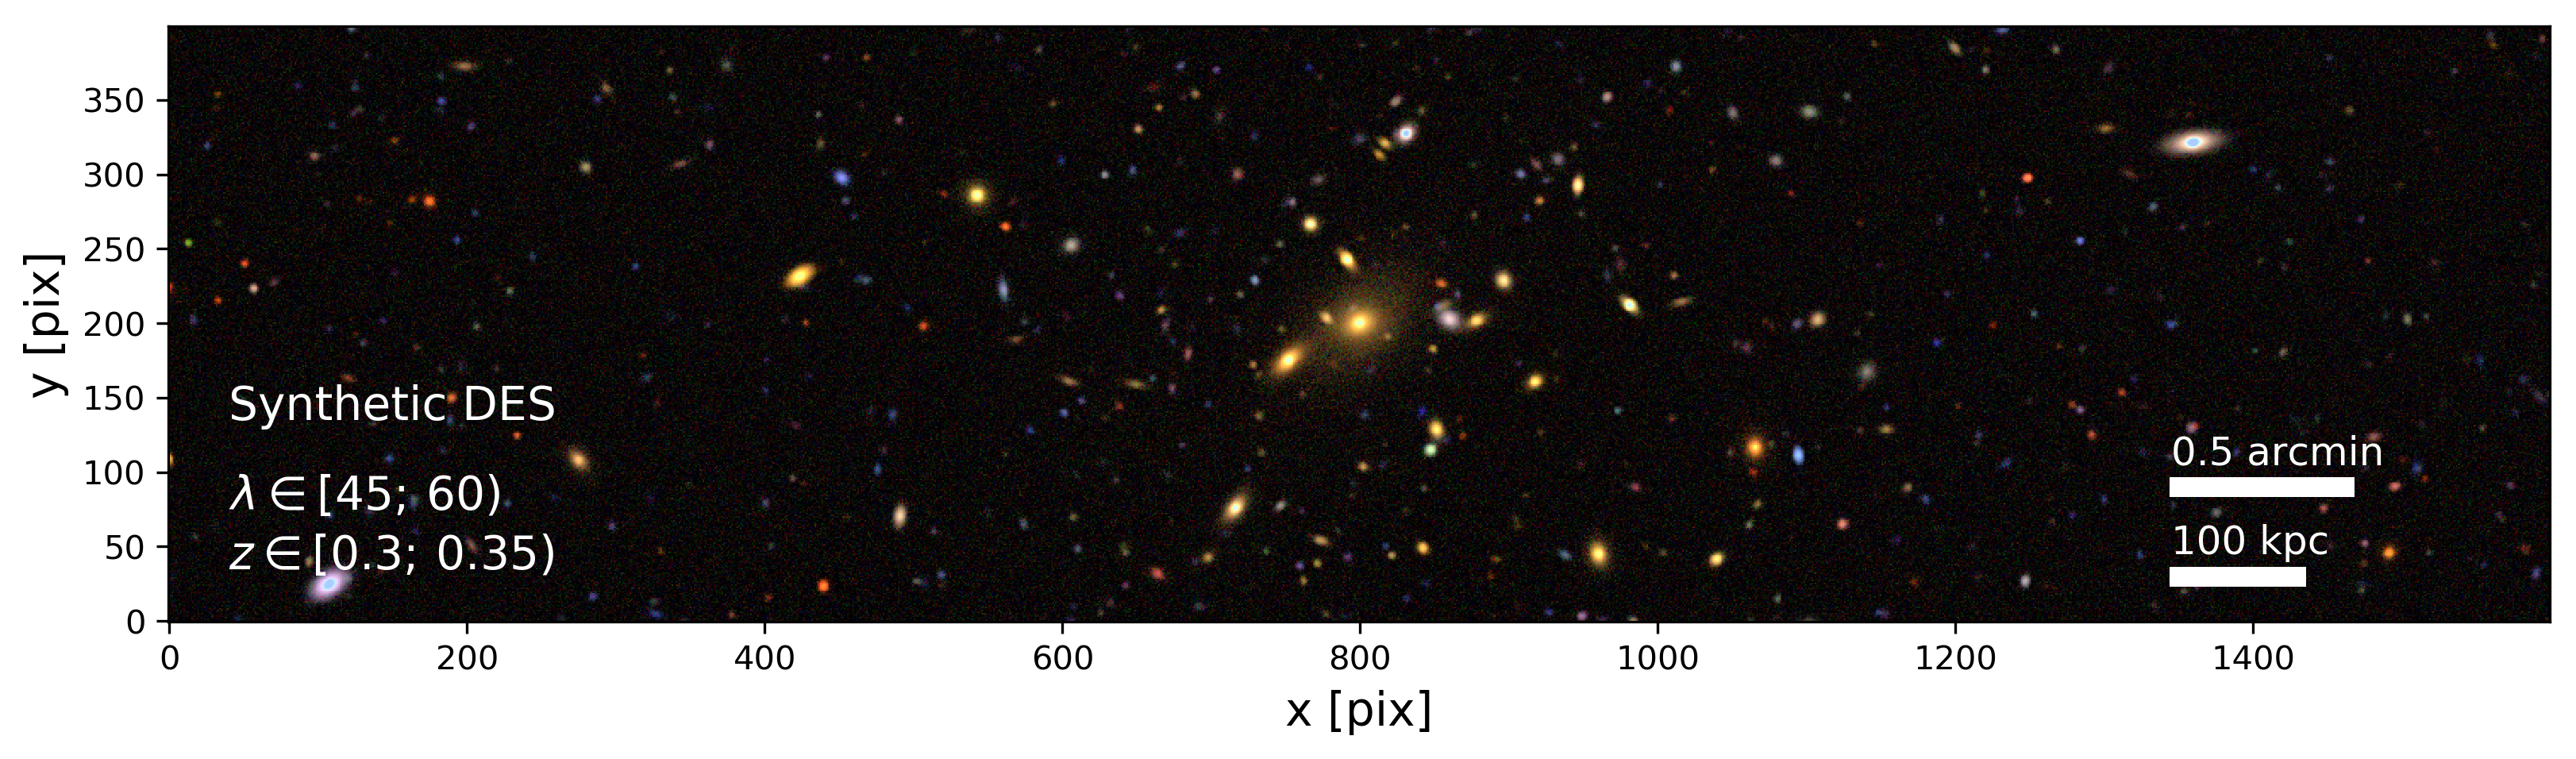
Can you guess which of these is real, and which is synthetic?
(does not count to scroll down ;)
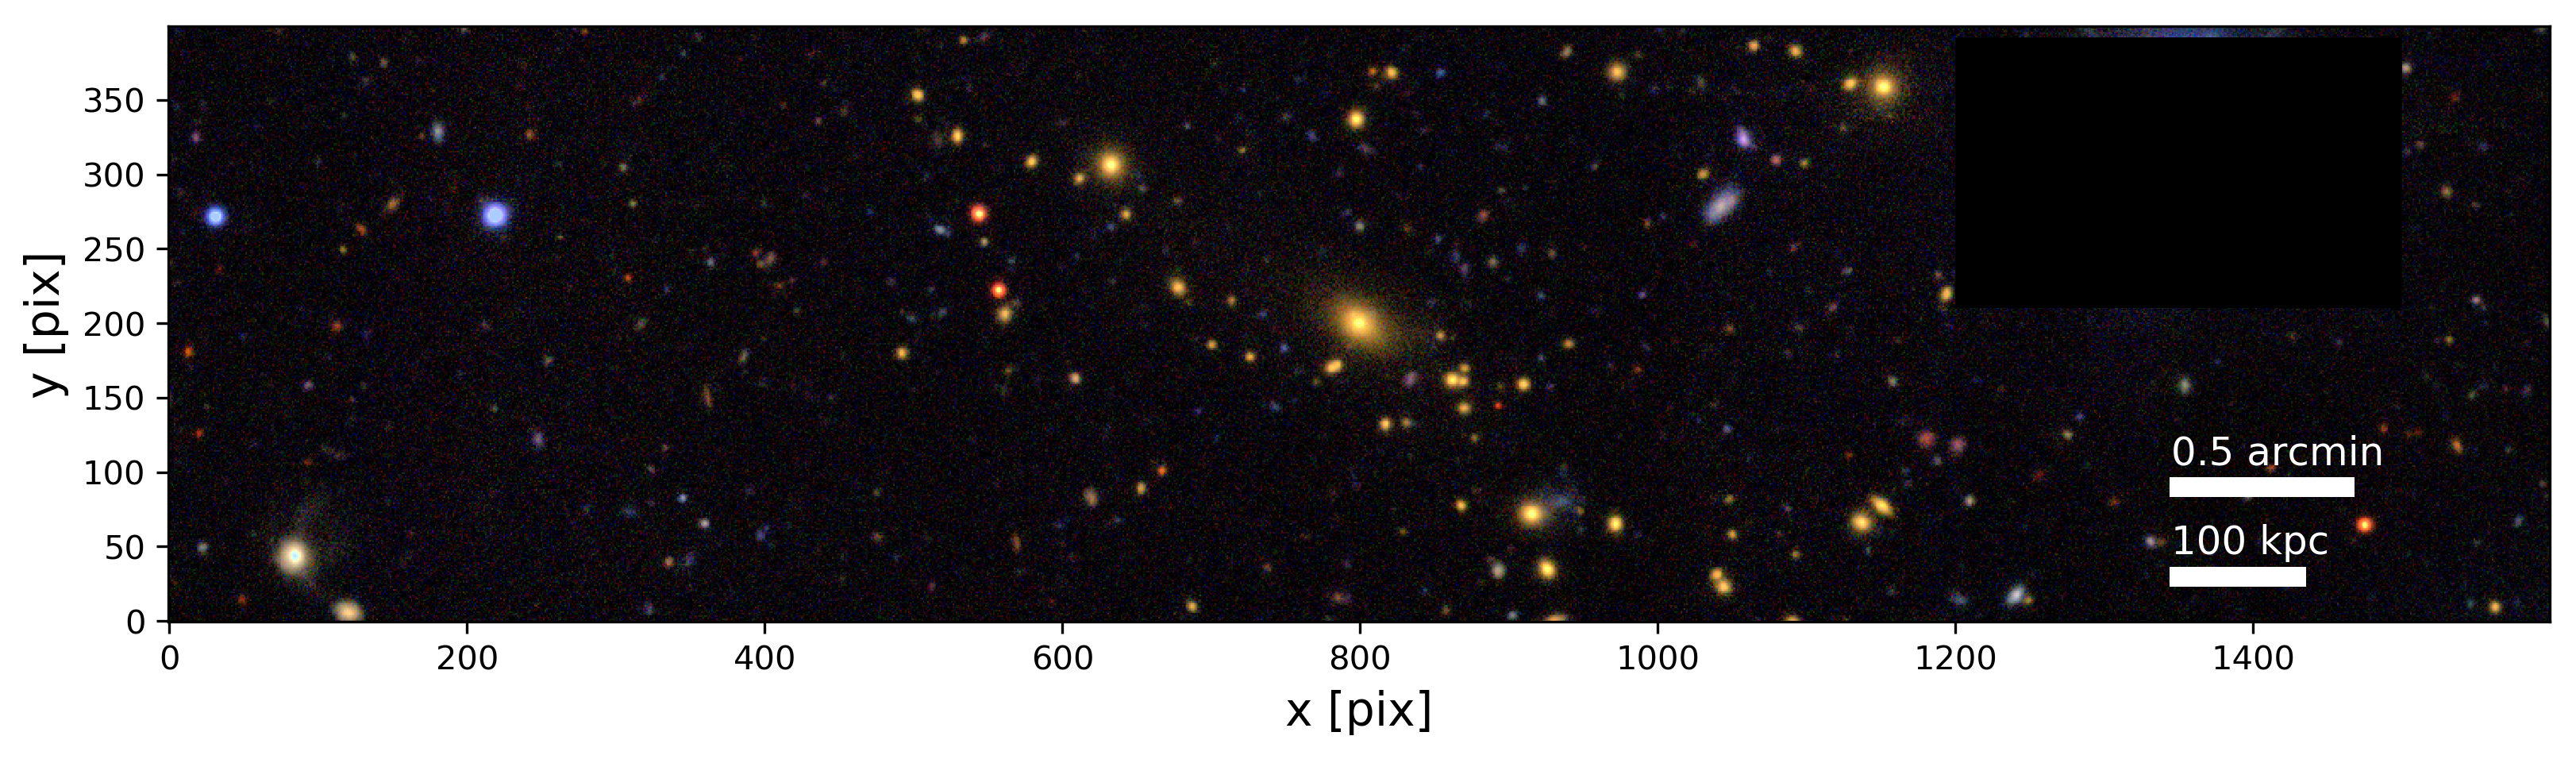
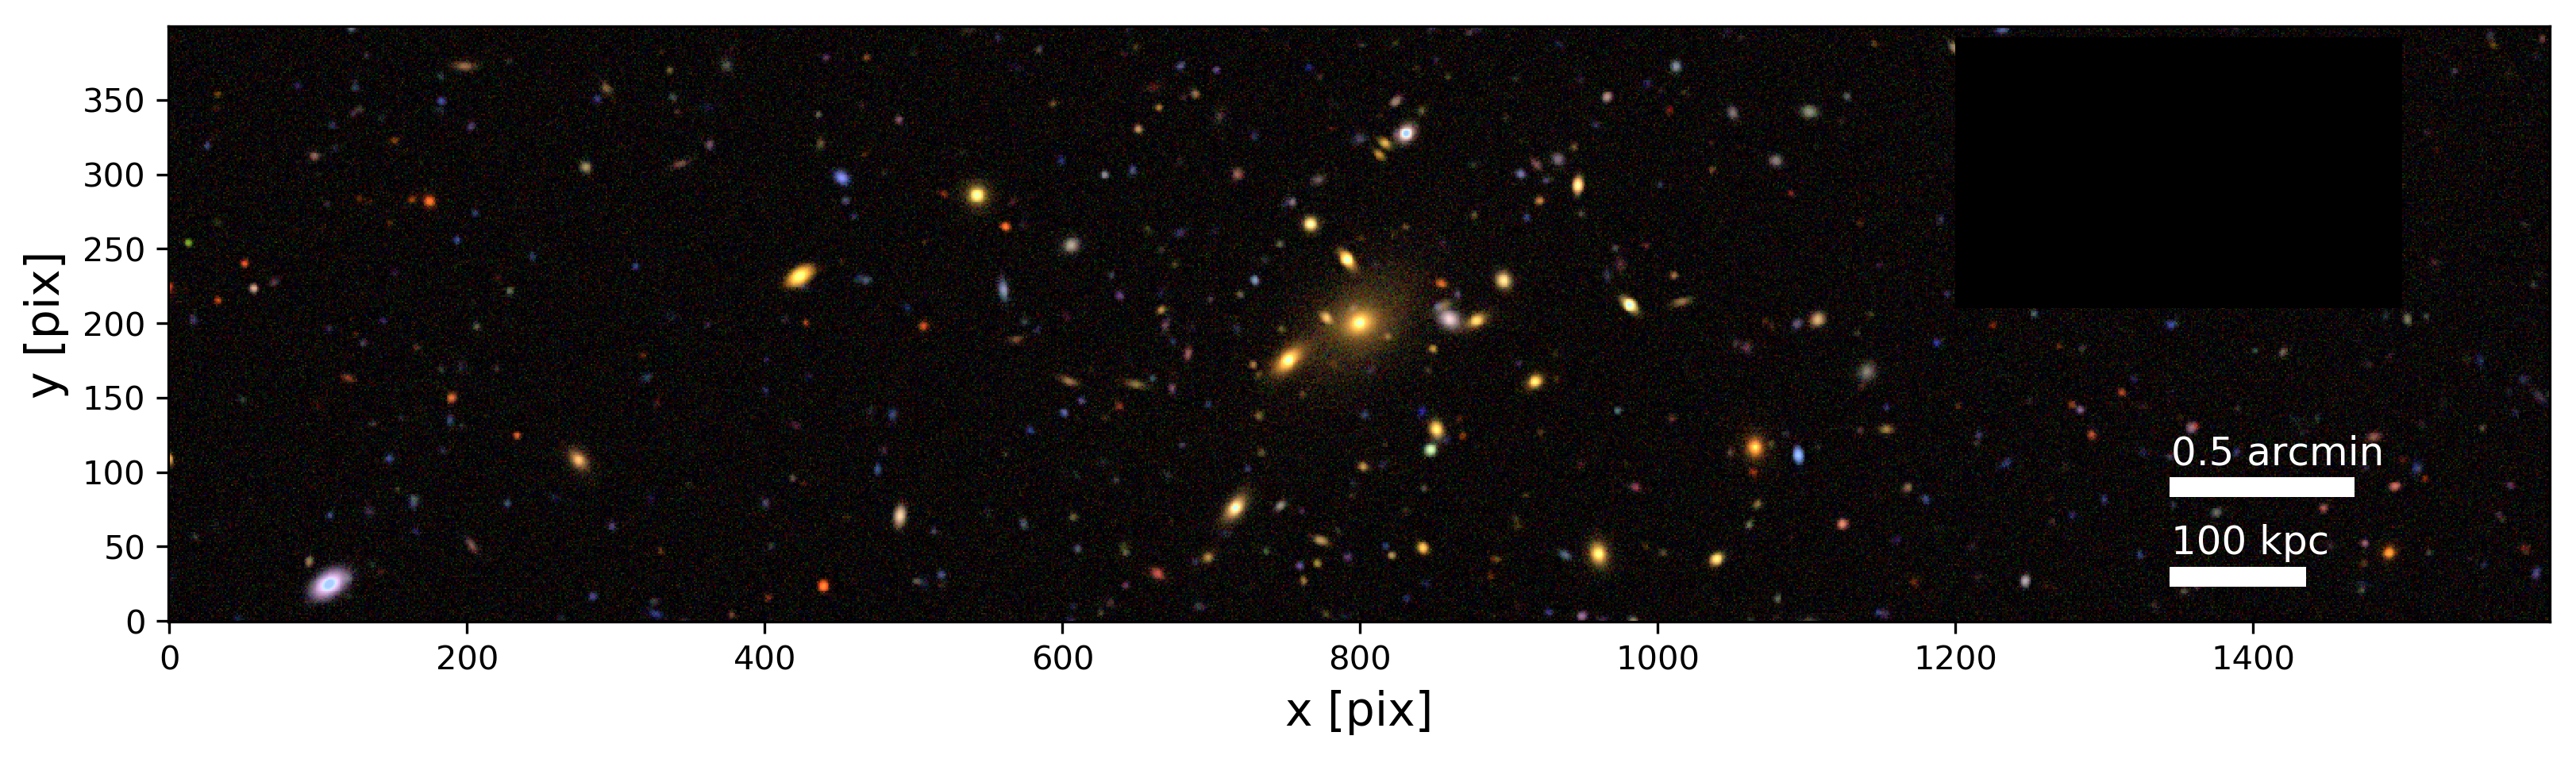
One of these is a redMaPPer selected cluster, and the other is created using our statistical learning algorithm, rendered into survey-like observation from an underlying mock photometry catalog.
…
They look quite alike!
of course the obvious bright star betrays real observations, but those are actually masked out when doing real data processing
We simulate the underyling shear and redshift catalog too!
These images are rendered to include faint galaxies and stars too, and incorporate a photometry, shear and redshift catalog underlying each image.
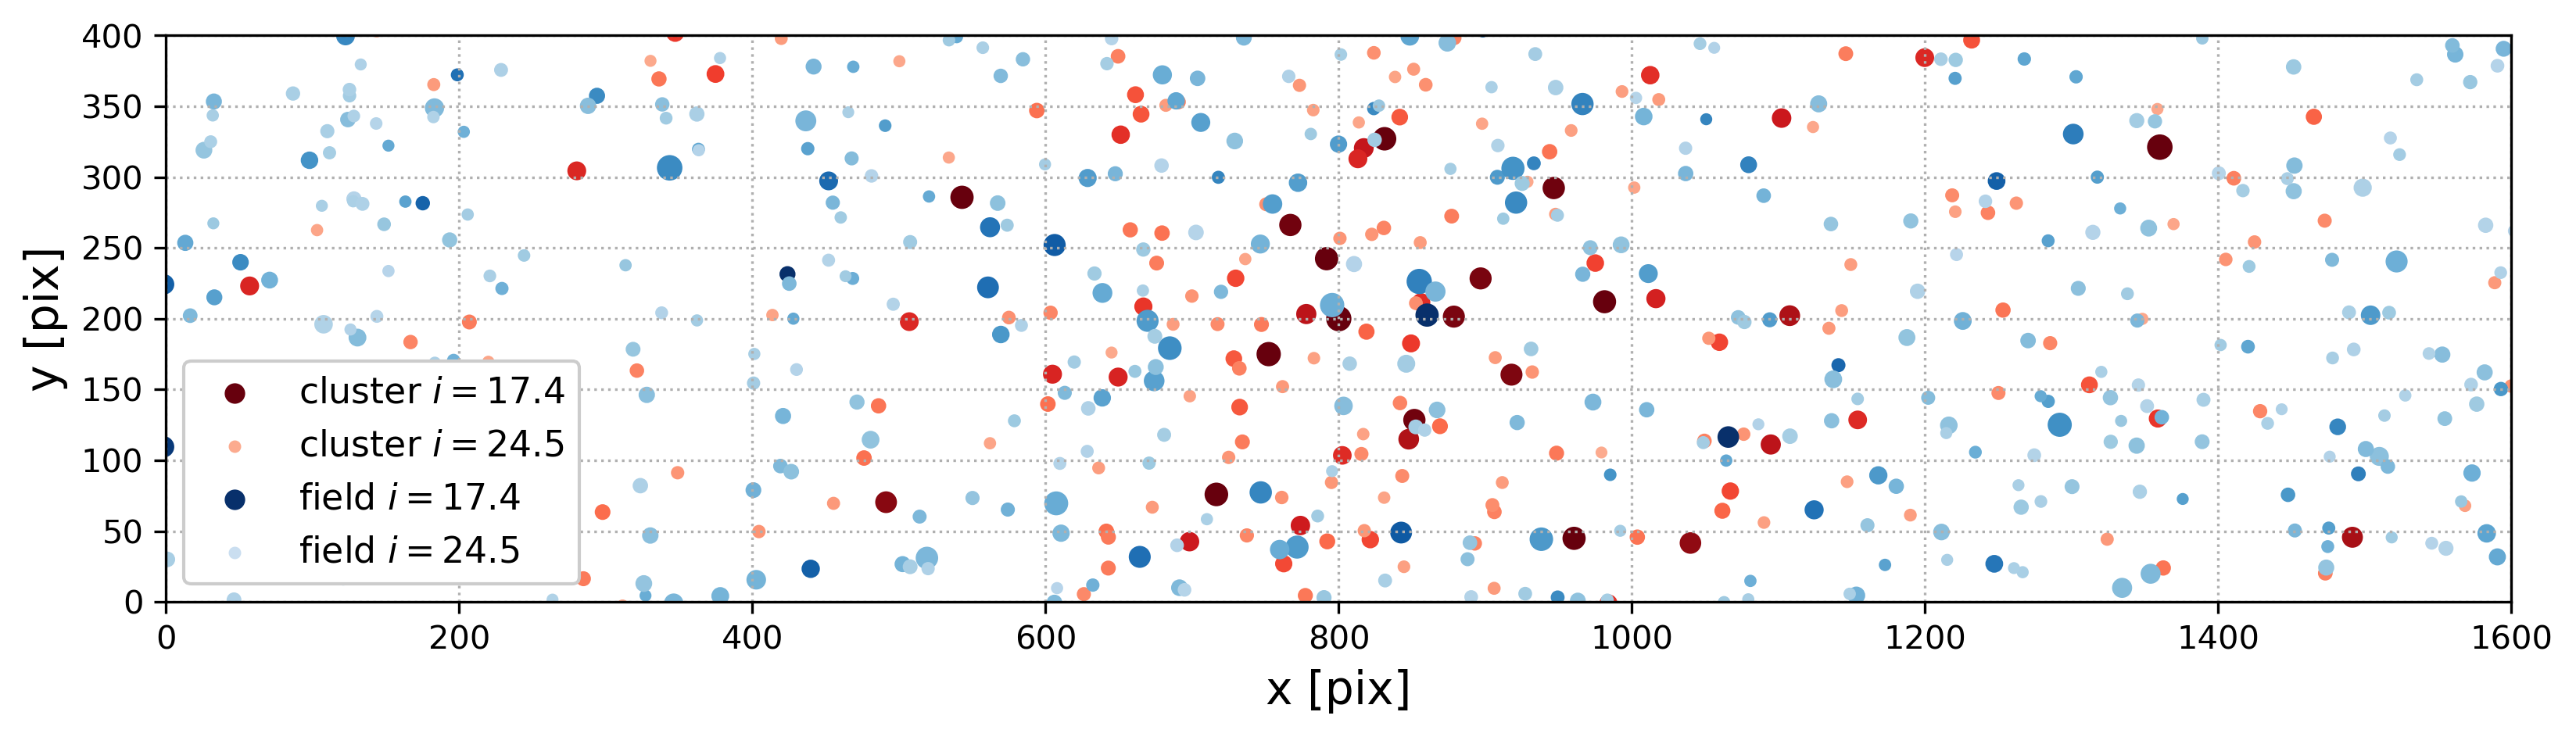 This above figure shows the brightness distribution of the synthetic light sources for cluster members (red/brown) and
foreground and background objects (blue). Darker shades and larger symbols correspond to brighter objects.
This above figure shows the brightness distribution of the synthetic light sources for cluster members (red/brown) and
foreground and background objects (blue). Darker shades and larger symbols correspond to brighter objects.
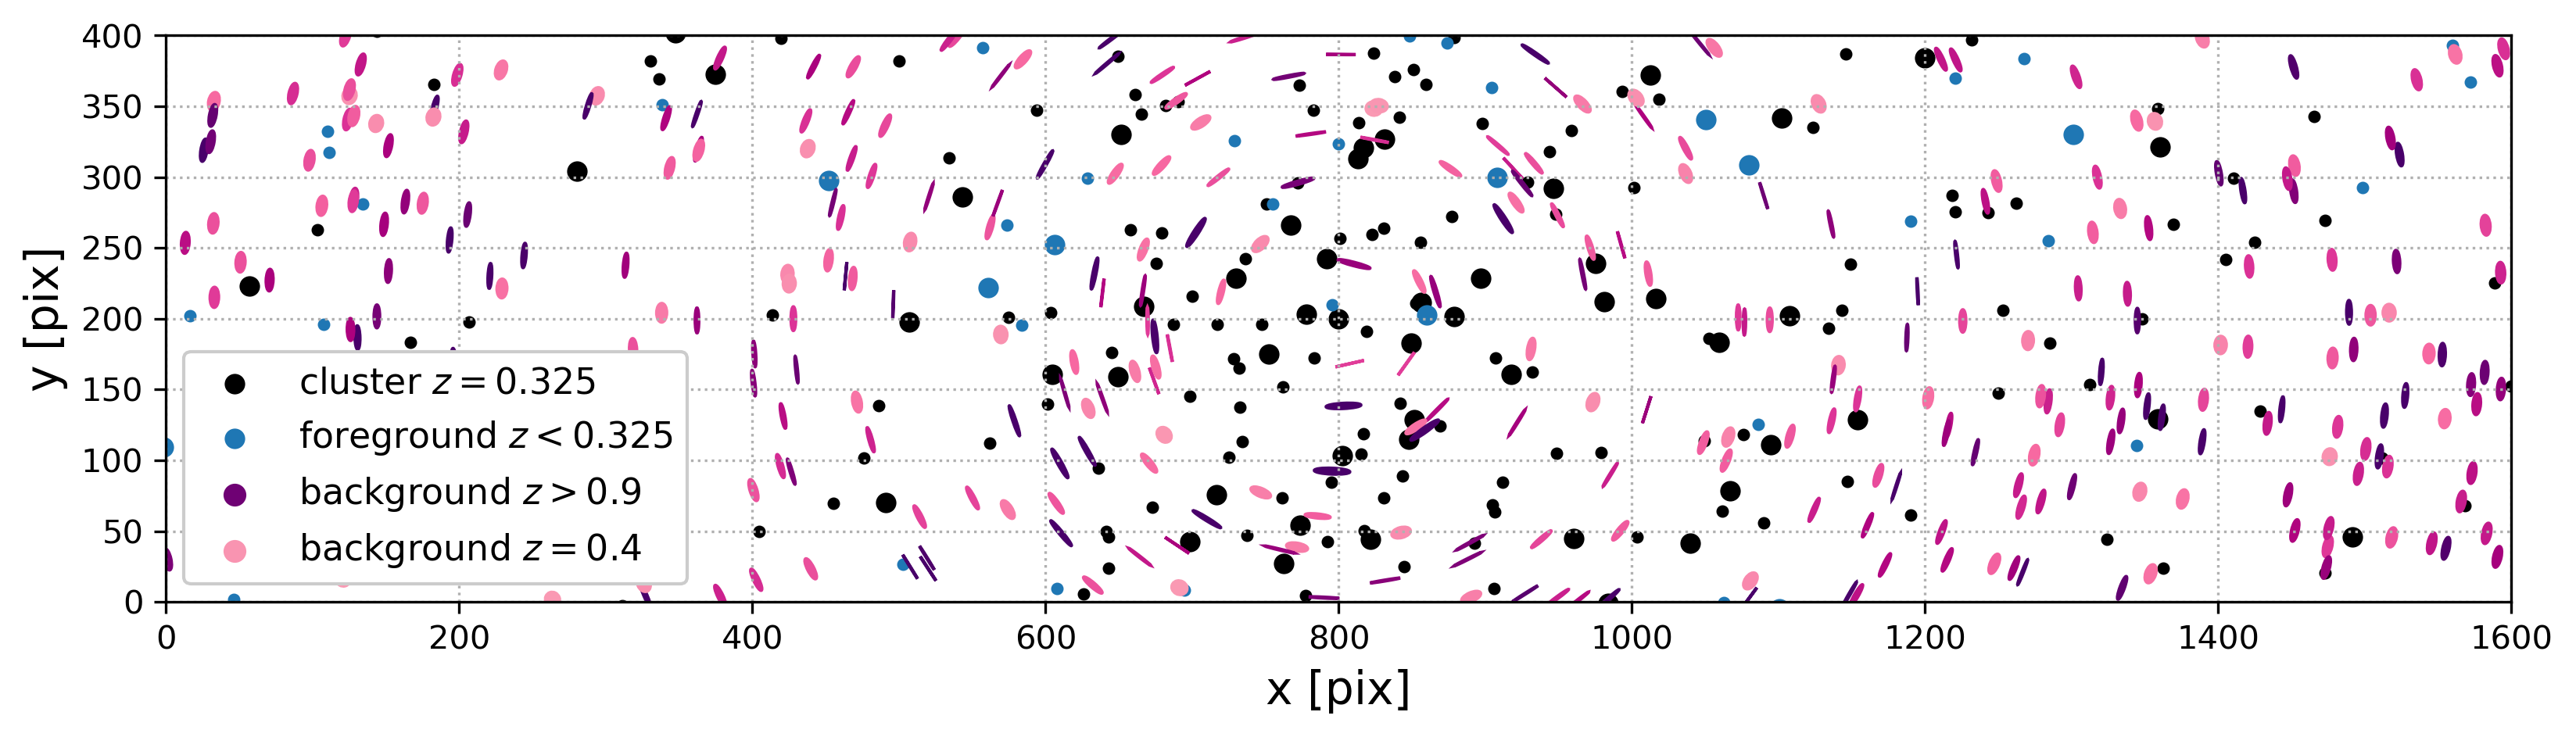 The above figure shows an exaggerated shear map of background sources (magenta ellipses, their ellipticity corresponds to approximately 20 times the gravitational shear) with the shade representing redshift, cluster members (black) and foreground sources (blue).